Data Analysis with SQL, Python & Tableau
Course Objective is to equip learners with practical data analysis skills using SQL for data extraction, Python for transformation, and Tableau for visualization, building complete analytical pipelines.
* Designed to teach learners how to analyze, transform, and visualize data using three powerful tools. This course blends querying, scripting, and dashboarding for real-world business intelligence and analytics.
* From Raw Data to Business Insights.
* Six Sigma emphasizing variation reduction
* Learn technical tools like kaizen
* 5 Principals & 6 Steps
* Statistical data analysis & process control
Duration: 25 Hours (5 weeks, Mon-Fri) (8 weeks, Sat,Sun)
1 Hour Training with Q&A, Practical
Fast Track Batch available*
INR 15,999/-
Enroll Now
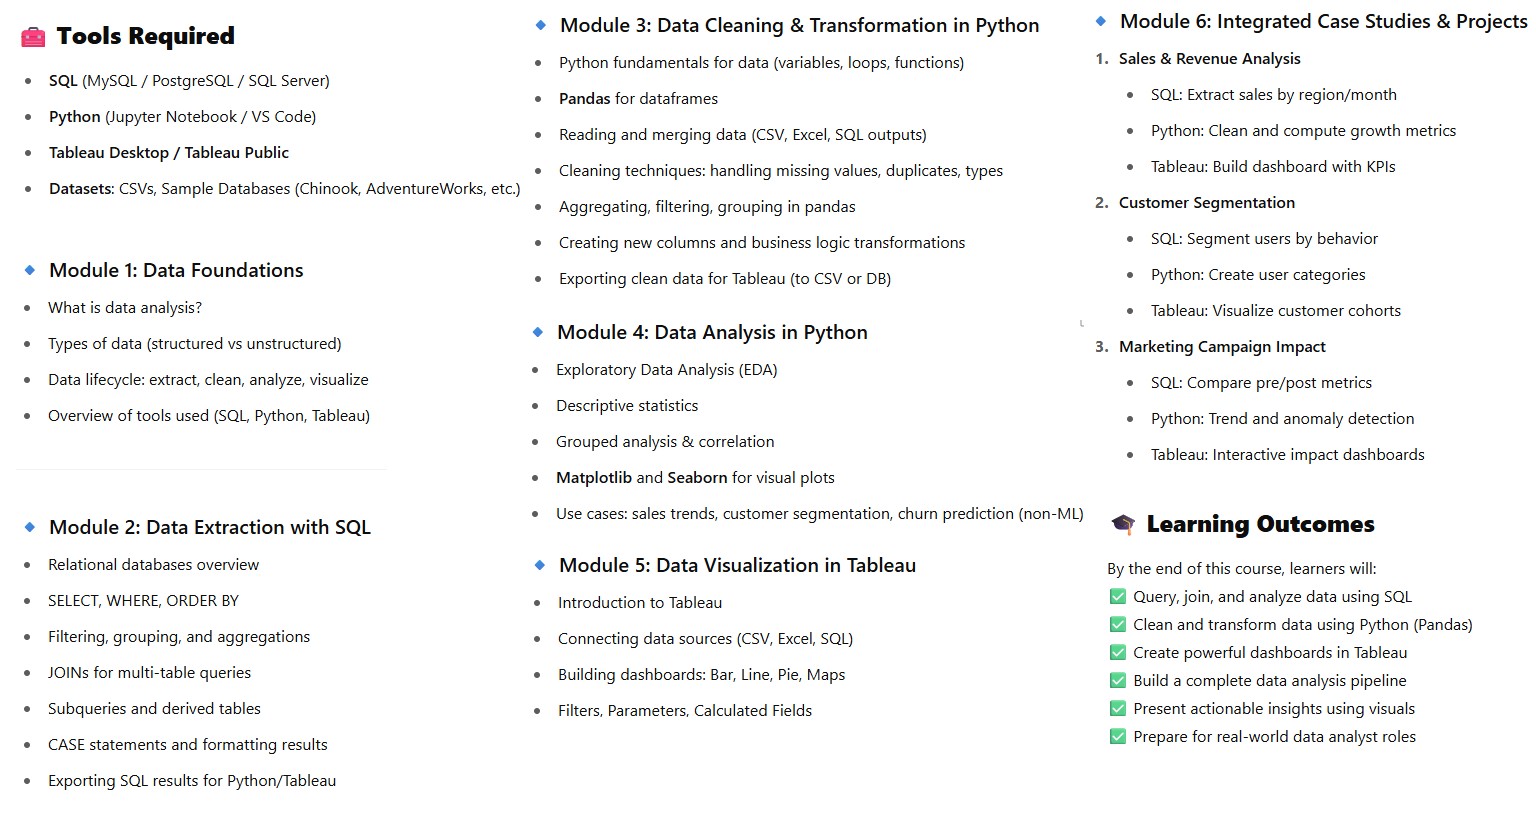
Course Outline - 6 Modules
Popular Courses
UI/UX Design
Introduces the fundamentals of User Interface (UI) and User Experience (UX) design, equipping learners with the creative and technical skills needed to design intuitive, user-centered digital products. Ideal for beginners looking to break into UI/UX design or enhance their digital design skill set.

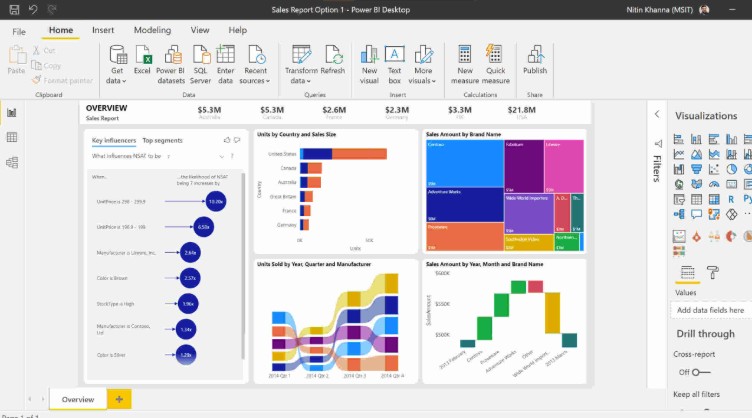
Power BI
Course objective is to learn how to transform raw data into meaningful insights using Power BI, Microsoft’s powerful business intelligence and data visualization tool. This course covers everything from data import and cleaning to interactive dashboards and DAX formulas.
MS Office & Sharepoint
Training course includes PowerPoint presentation software by Microsoft used to create slideshows combining text, images, charts, videos, and animations—commonly used for business, education, and personal presentations.

Front-End Development
Equip learners with in-demand skills in front-end web technologies, enabling them to build responsive, interactive, and visually engaging websites and applications using HTML, CSS, JavaScript, and modern front-end frameworks.